
Engineers are often told to "watch the metrics," but metrics without interpretation are just decorated uncertainty.
This project does a better job than most of connecting the numbers to behavior. The repo does not stop at a headline score. It explains what each metric means, where the model is strong, and where the numbers hint at data or localization problems.
Precision and Recall Are Product Questions
Not abstract. These concepts surface directly in user experience. Every error propagates into the product.
Precision asks:
When the detector says it found a region, how often is that claim correct?
Recall asks:
When a region really exists, how often does the detector find it?
If precision is low, the product hallucinates structure. If recall is low, the product misses useful information. Both are annoying in different ways.

Why mAP50 Is Only Half the Story
The repo's strongest reported performance is excellent at mAP50. That means the detector usually places boxes with enough overlap to count as correct under a forgiving threshold.
That is good news. It means the model has learned the task.
But mAP50-95 tells the harder truth: how well does localization hold up when the overlap requirement becomes strict?
For this project, the gap between those metrics is not failure. It is signal.

Small Regions Distort Strict Metrics
The repo's metrics guide explains the pattern clearly: large regions tolerate small coordinate errors well. Small regions do not.
Think about the art box versus the mana-cost box. A two-pixel shift barely changes the IoU of a large art rectangle, but it can materially hurt the IoU of a tiny mana-cost label. That is why small classes often show a larger gap between relaxed and strict metrics.
This is not merely "the model is worse at small objects." It can also mean:
- annotation boxes are slightly inconsistent
- labels around tiny regions are noisy
- strict IoU punishes small-box error much harder
Per-Class Analysis Is Where the Story Lives
Mean metrics are useful, but class-level metrics are more honest.
In this project, the broad pattern is intuitive:
- large classes like
art,card, anddescriptionperform strongly - smaller classes like
mana-costandpowerare harder - narrow text bands like
titleandtagsare sensitive to localization precision
Those results line up with the product's geometry and the dataset's annotation difficulty. That coherence is what makes the metrics trustworthy.
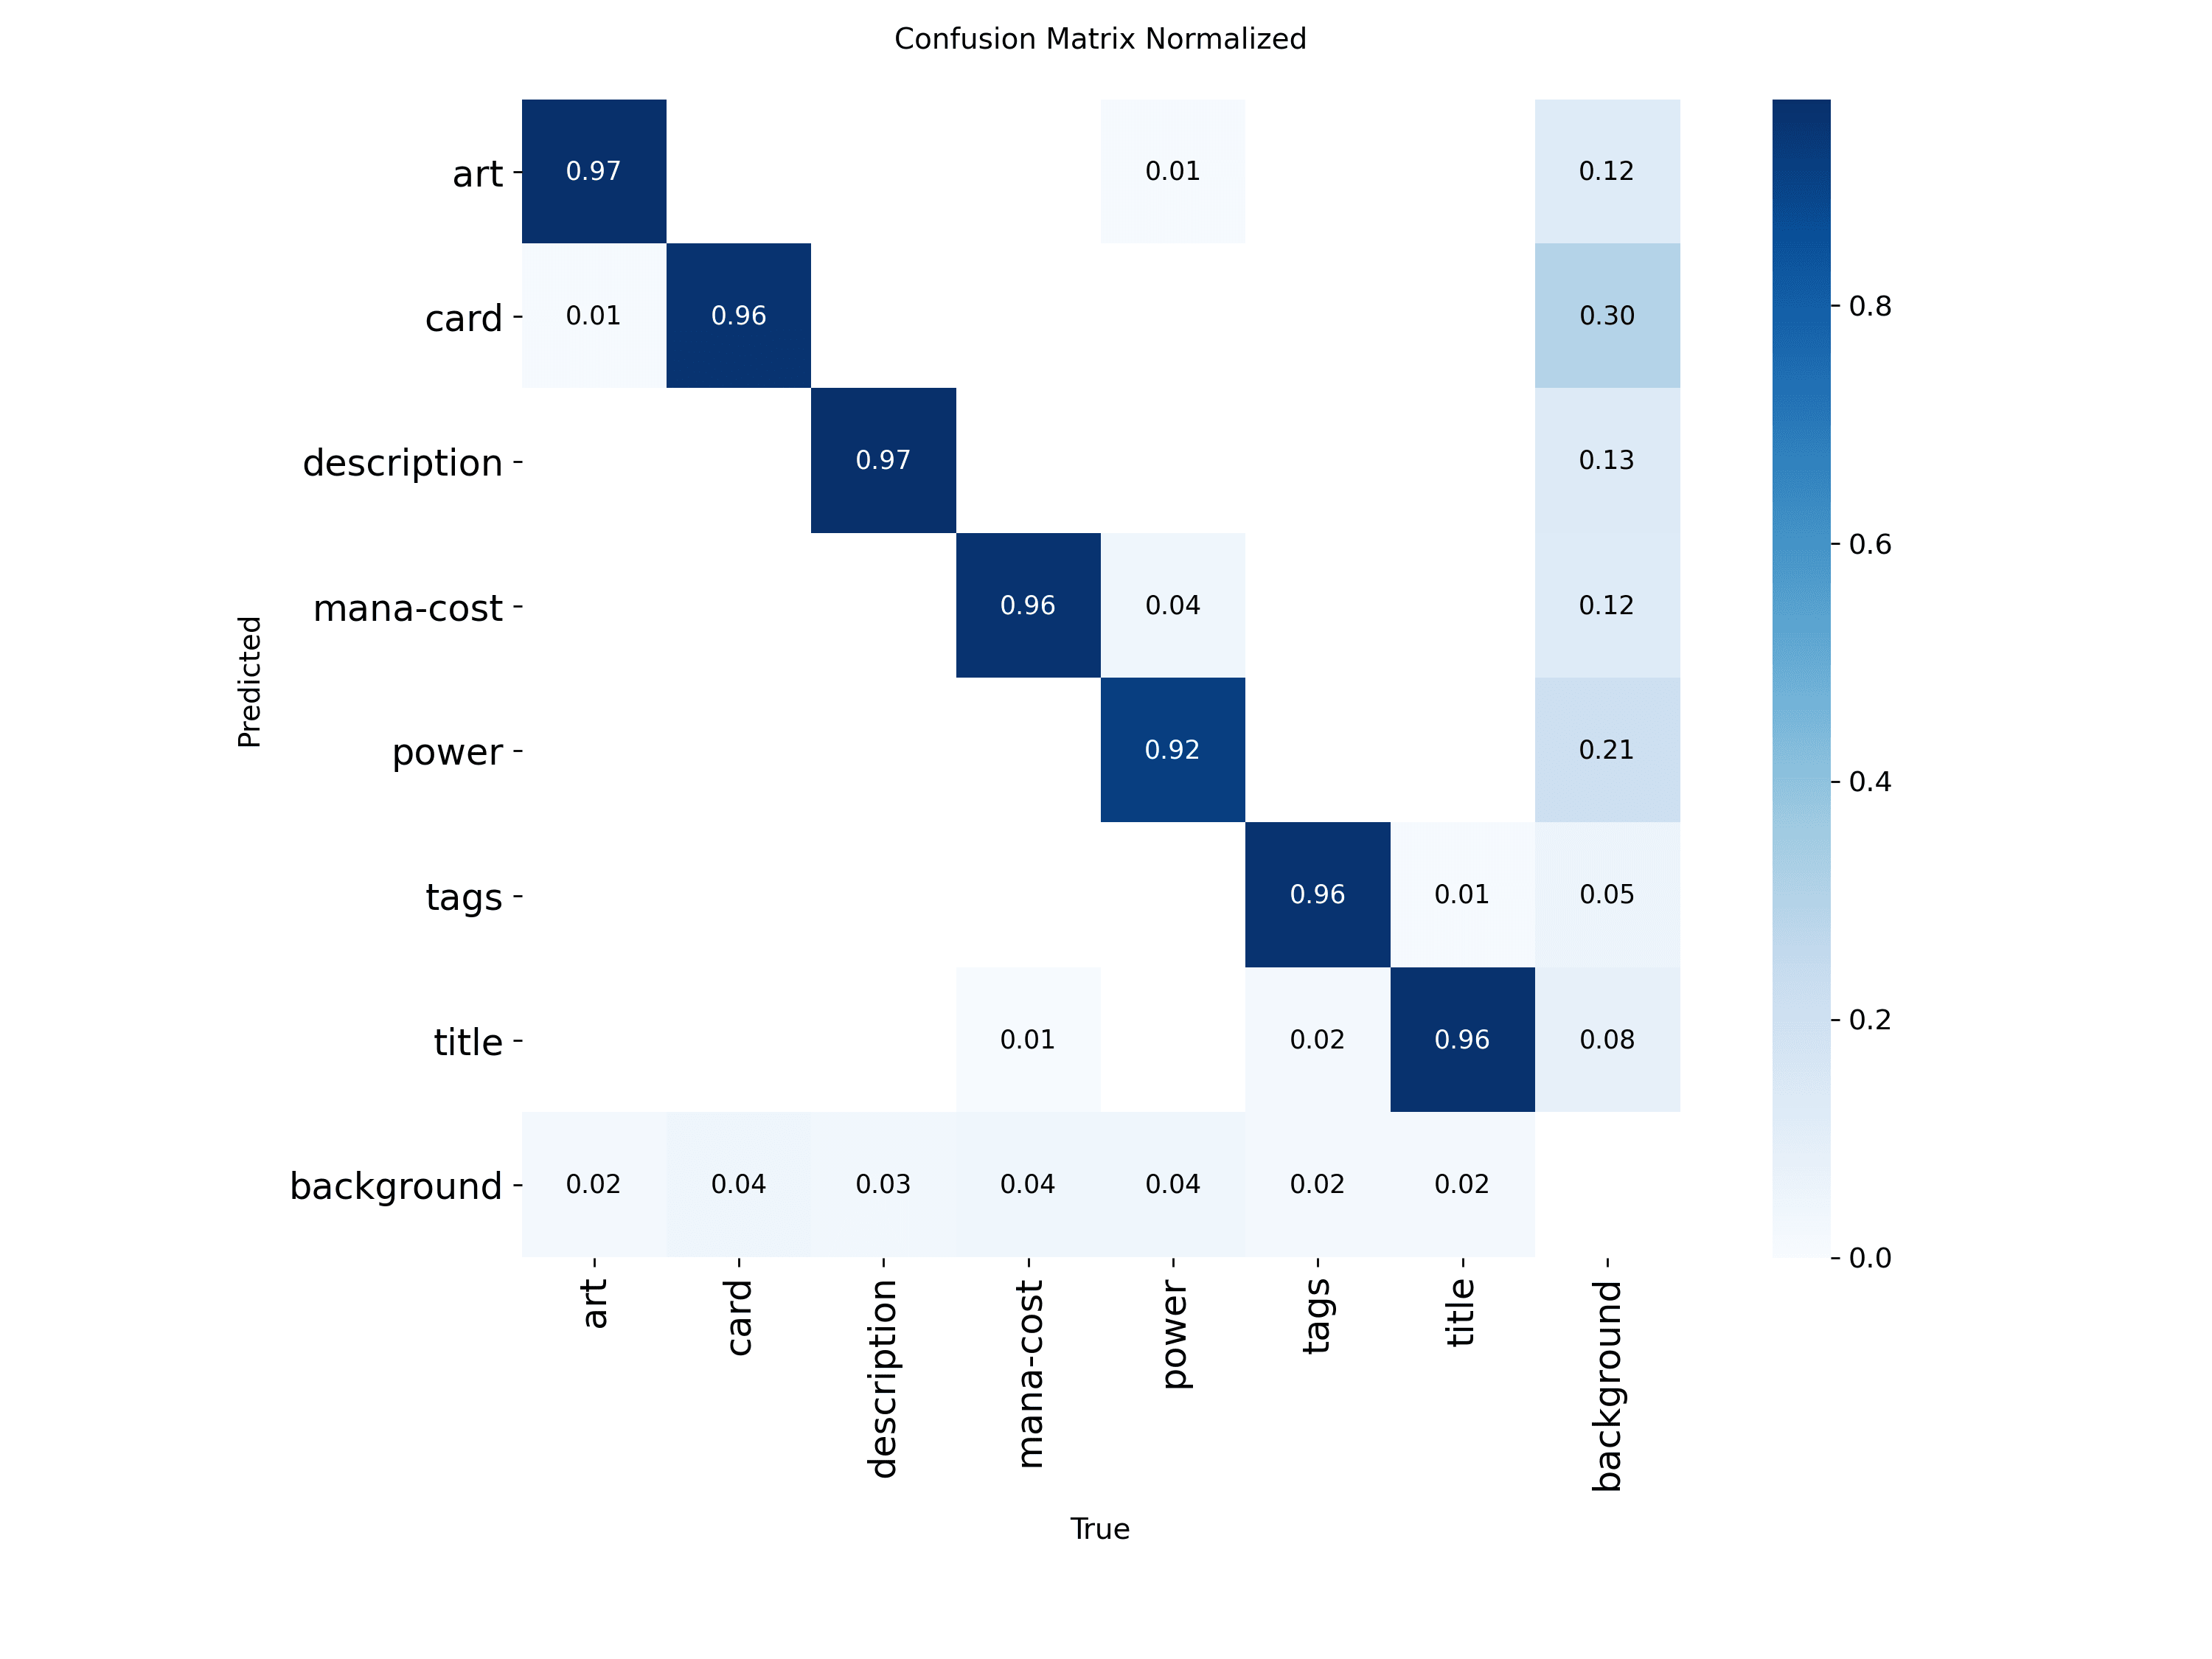
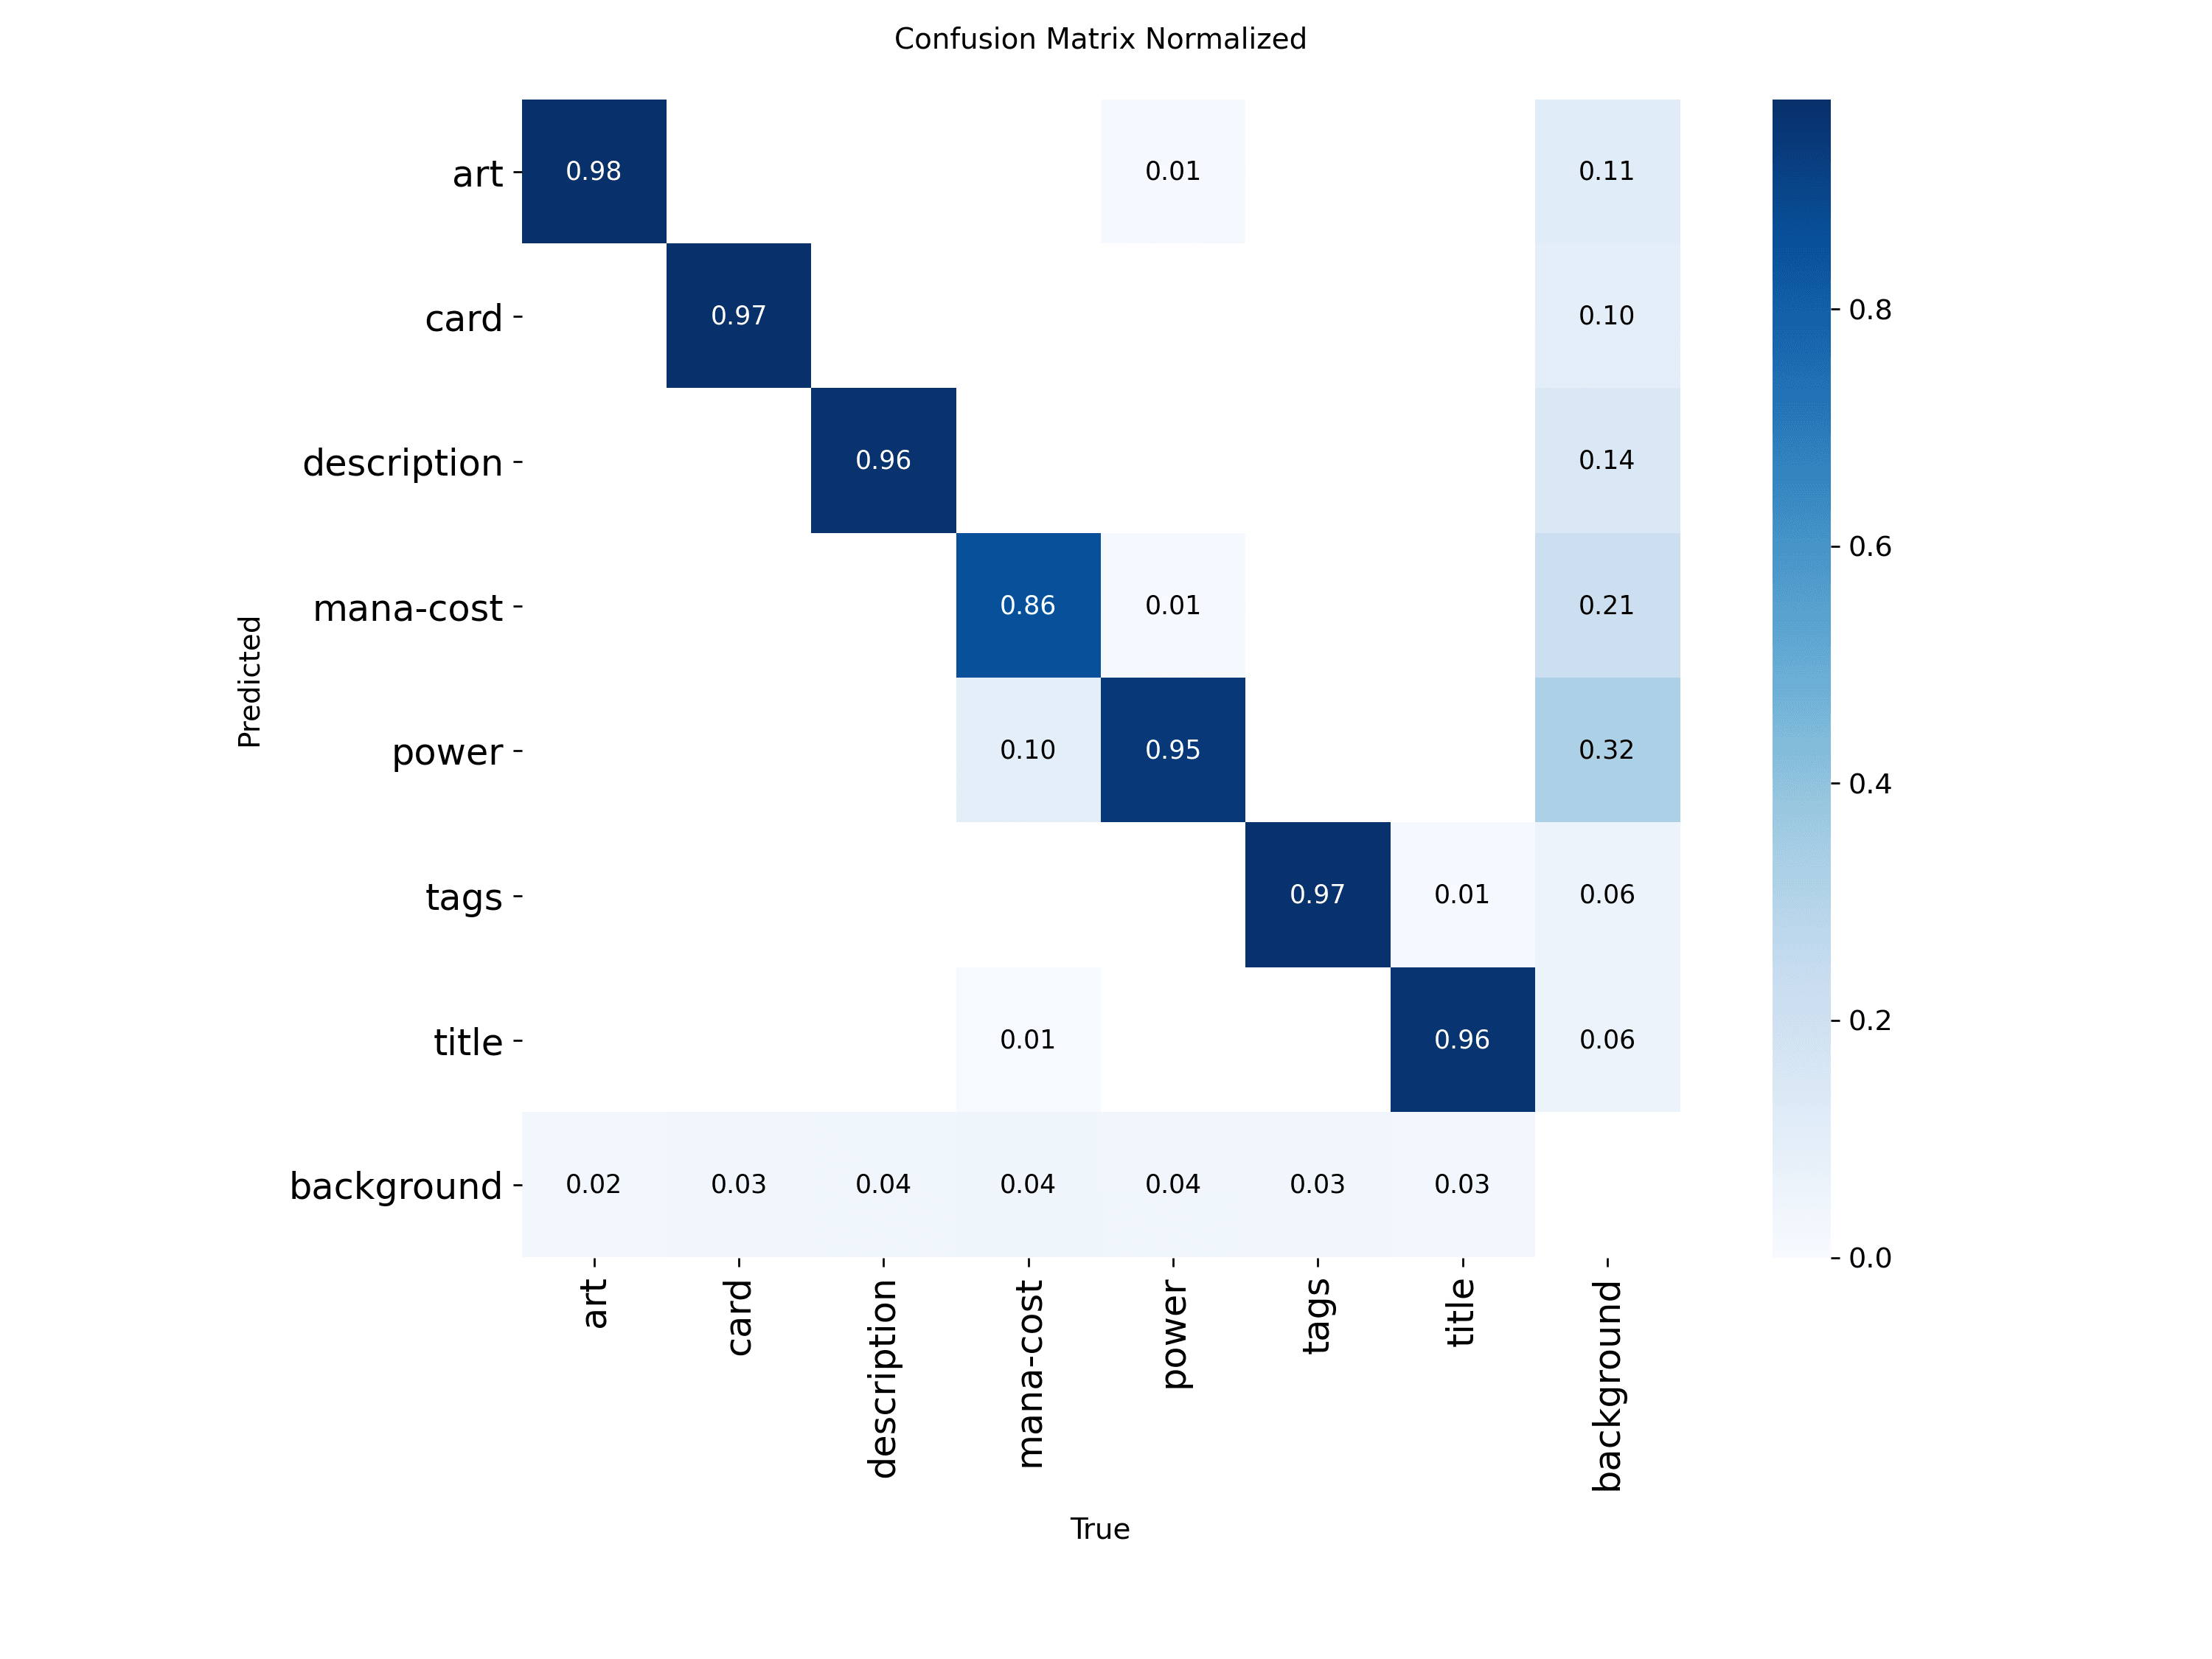
Confusion Matrices Need Context
A confusion matrix can look scientific without being useful. The real question is whether the confusion pattern makes sense for the task. If it does not, the detector is telling you where the pipeline is misaligned.
For this detector, plausible confusion includes:
titlevstagsdescriptionvs neighboring text regions- partial card boundaries under challenging framing
That kind of confusion is understandable because the regions are semantically related and visually adjacent. It is a believable mistake. If the detector were confusing art with mana-cost constantly, that would point to a structural problem instead.
Metrics Should Influence the Pipeline
This is the part many ML posts miss. The metric is not the end of the story. It tells the rest of the pipeline what it can safely assume.
Examples:
- Strong
titledetection helps OCR by delivering cleaner crops. - Strong
artdetection helps DINOv2 by isolating the right visual content. - Weaker small-box precision may be acceptable if those classes are not critical in the first production path.
That is why product context matters. A detector can be imperfect in areas that do not break the user-facing experience, and unacceptable in areas that do.
A Good Metric Reading Produces Decisions
When I read this repo's metrics, the decisions it suggests are:
- keep the current baseline because it is strong where the pipeline needs strength
- improve labels if the goal is to raise strict localization quality
- be careful about assuming bigger models are the right next step
- optimize around downstream reliability, not only benchmark aesthetics
That is exactly what good measurement should do.
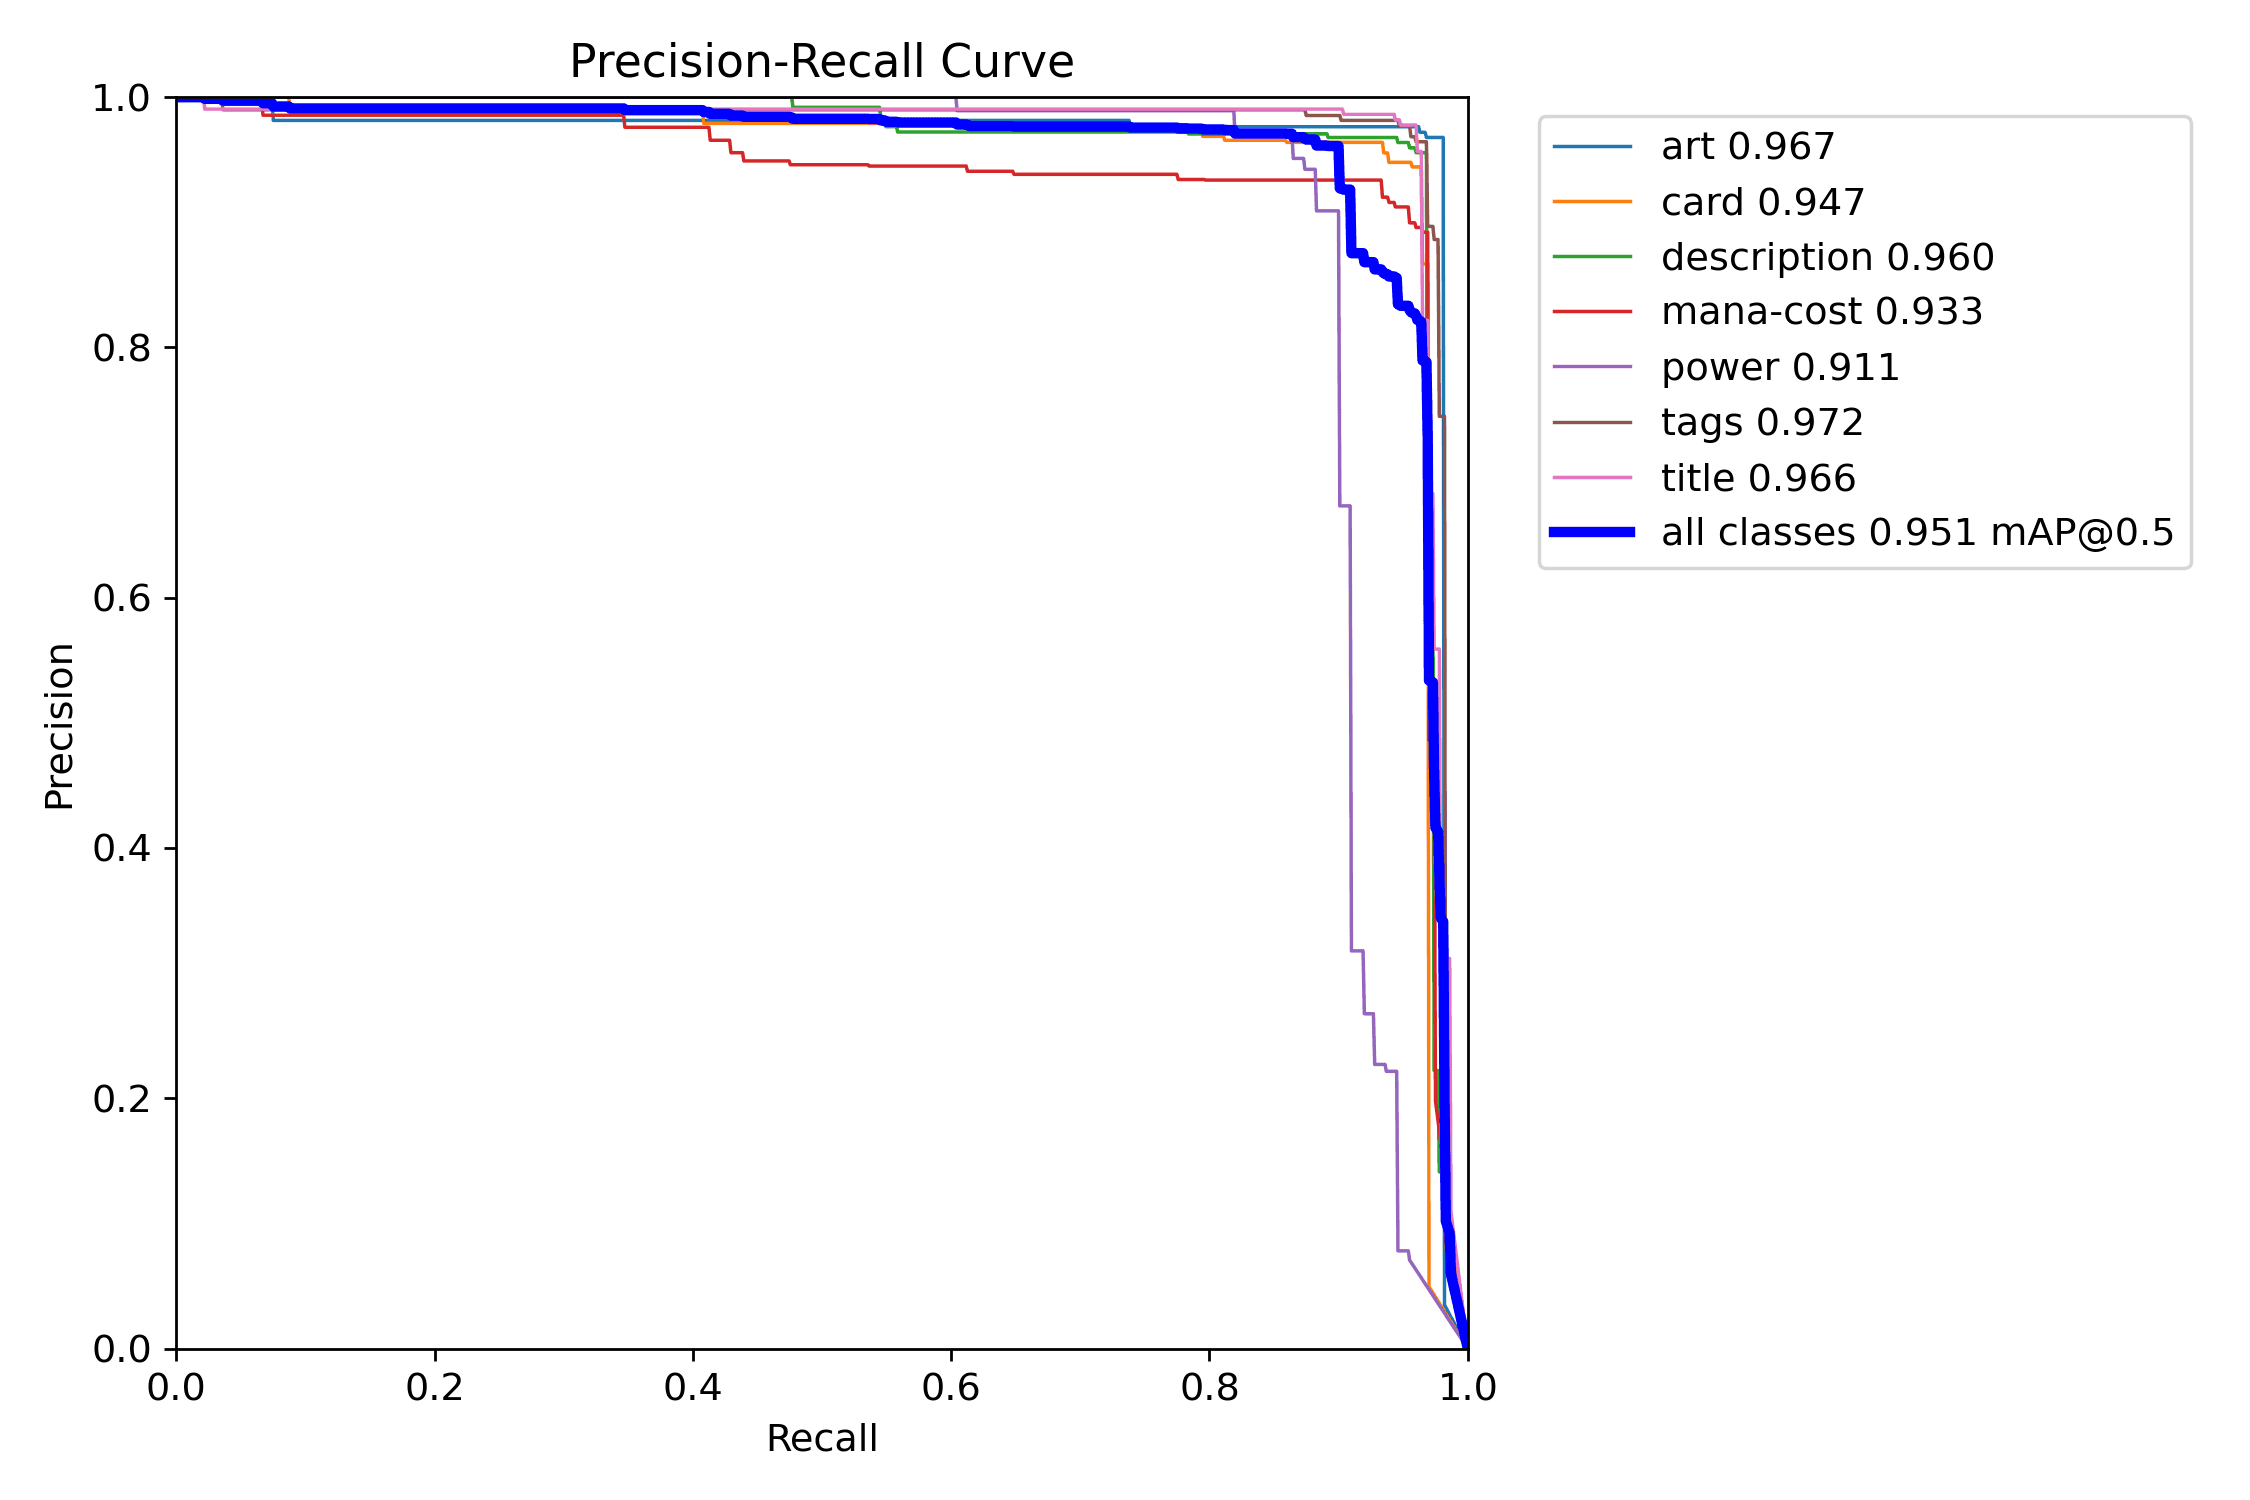
Start with the PR curve. It answers the biggest question first: does the detector remain useful as you try to recover more real regions?
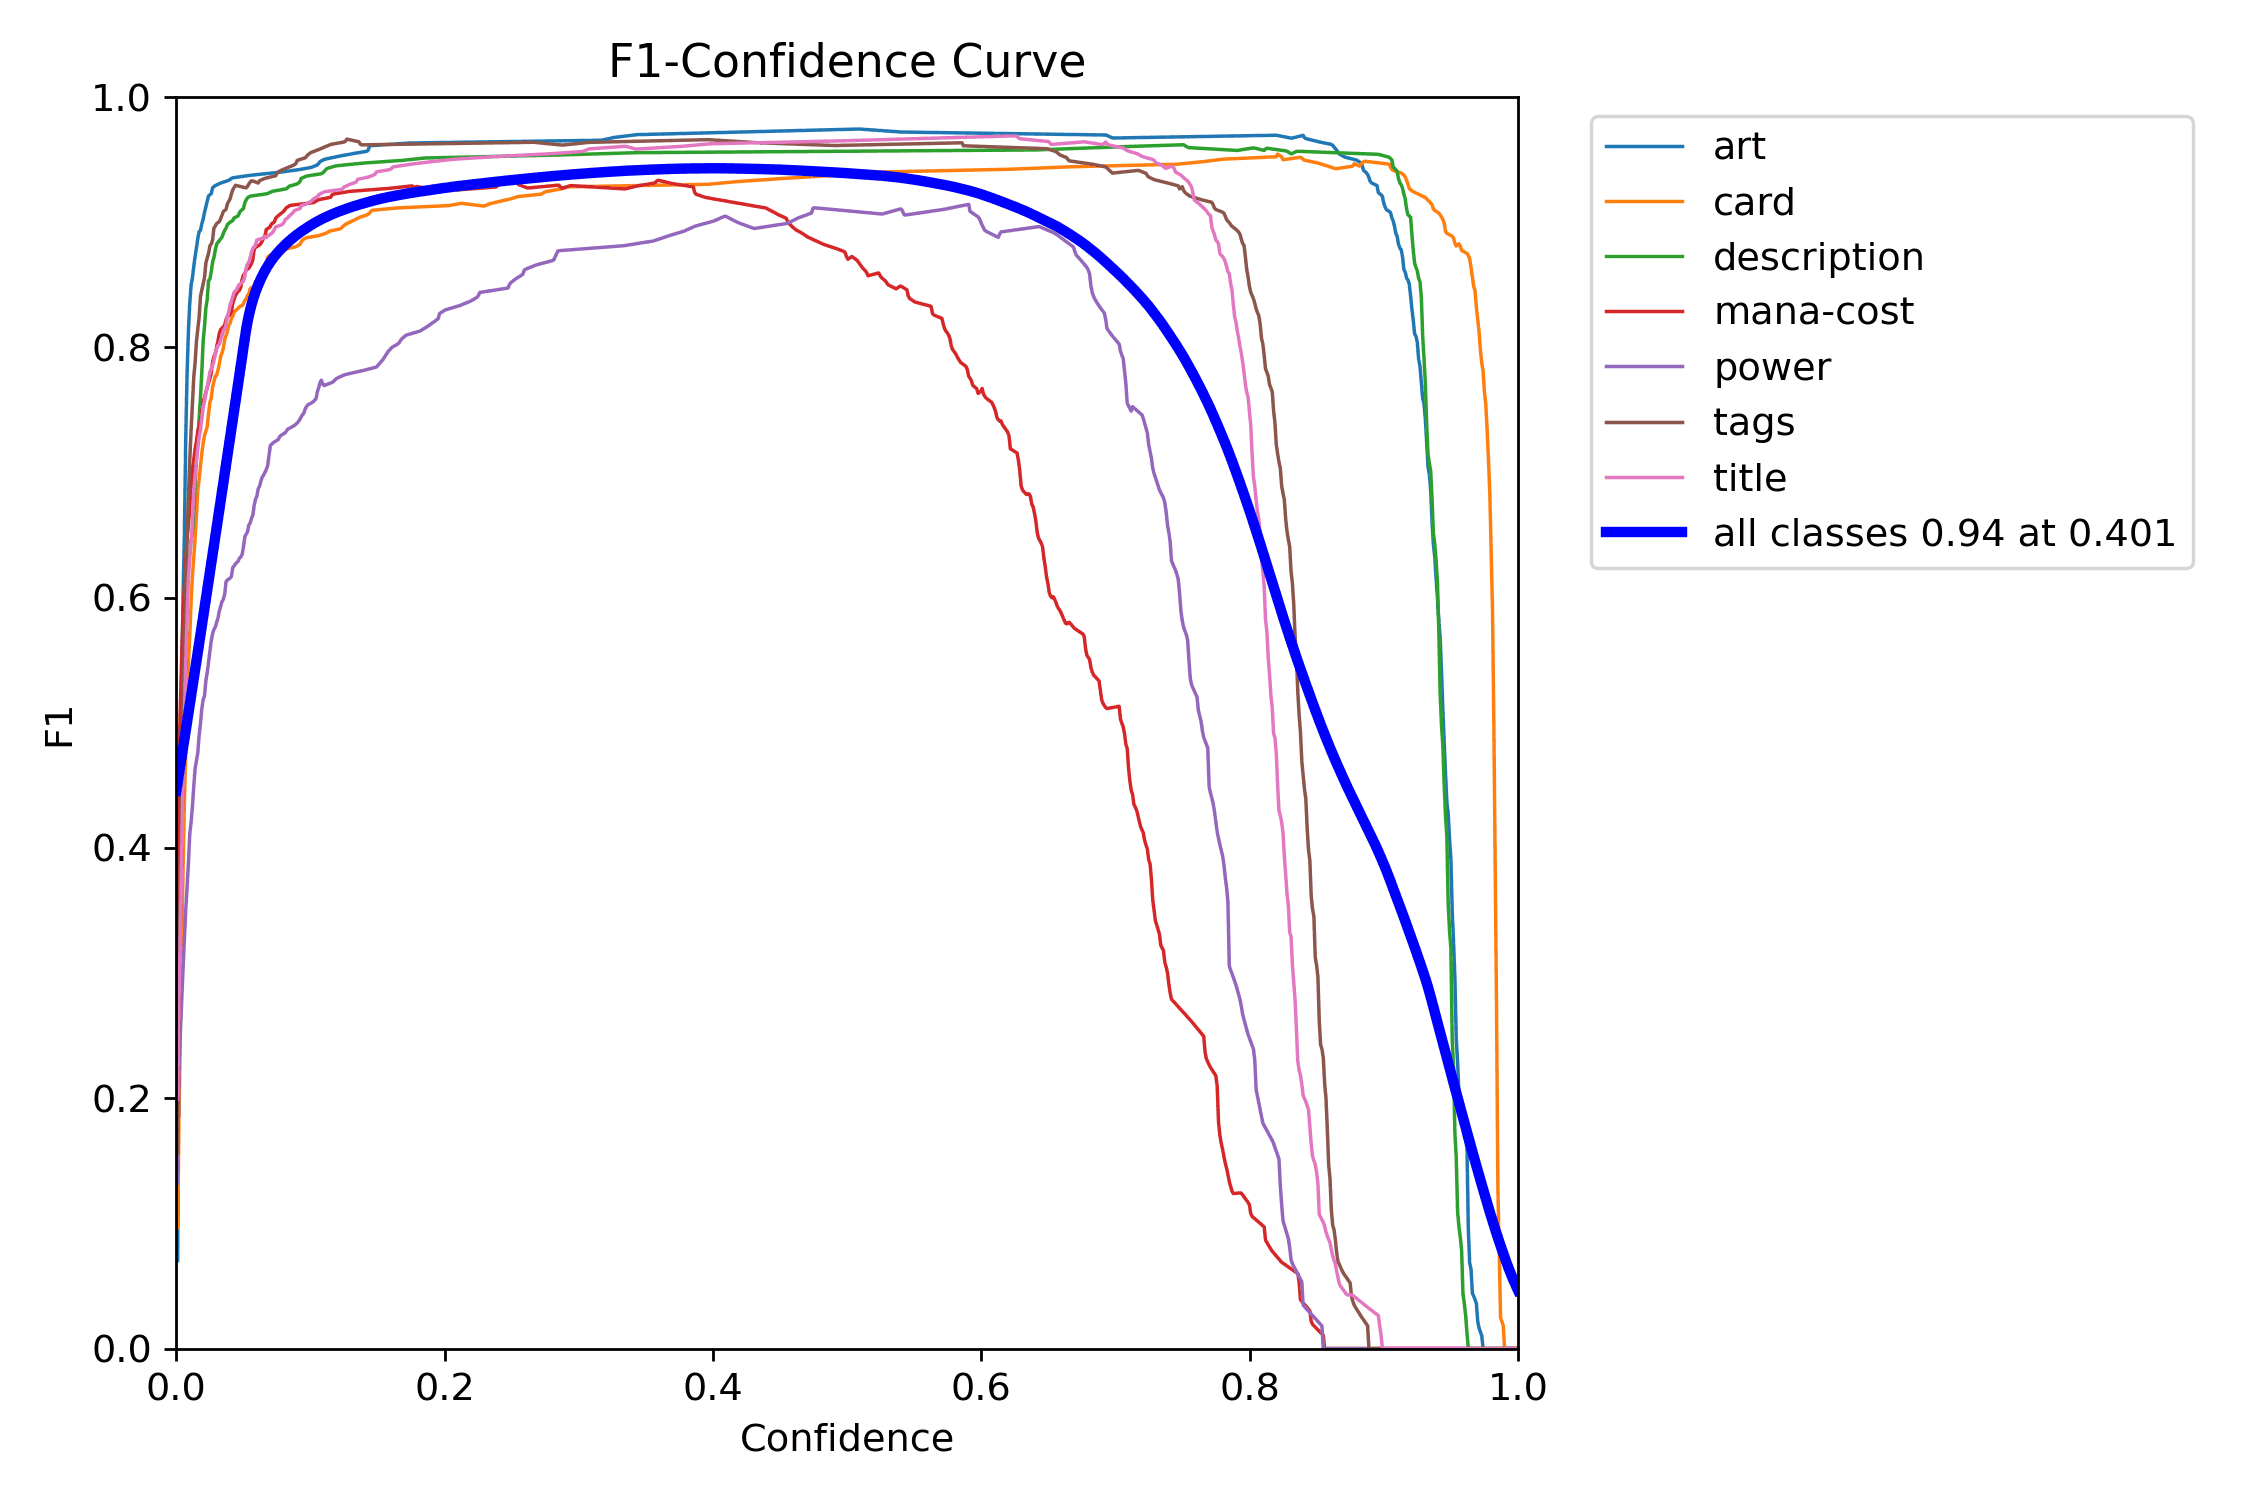
Then look at the F1 curve to choose an operating point instead of guessing. It is the fastest way to see where the detector's trade-off feels most balanced.
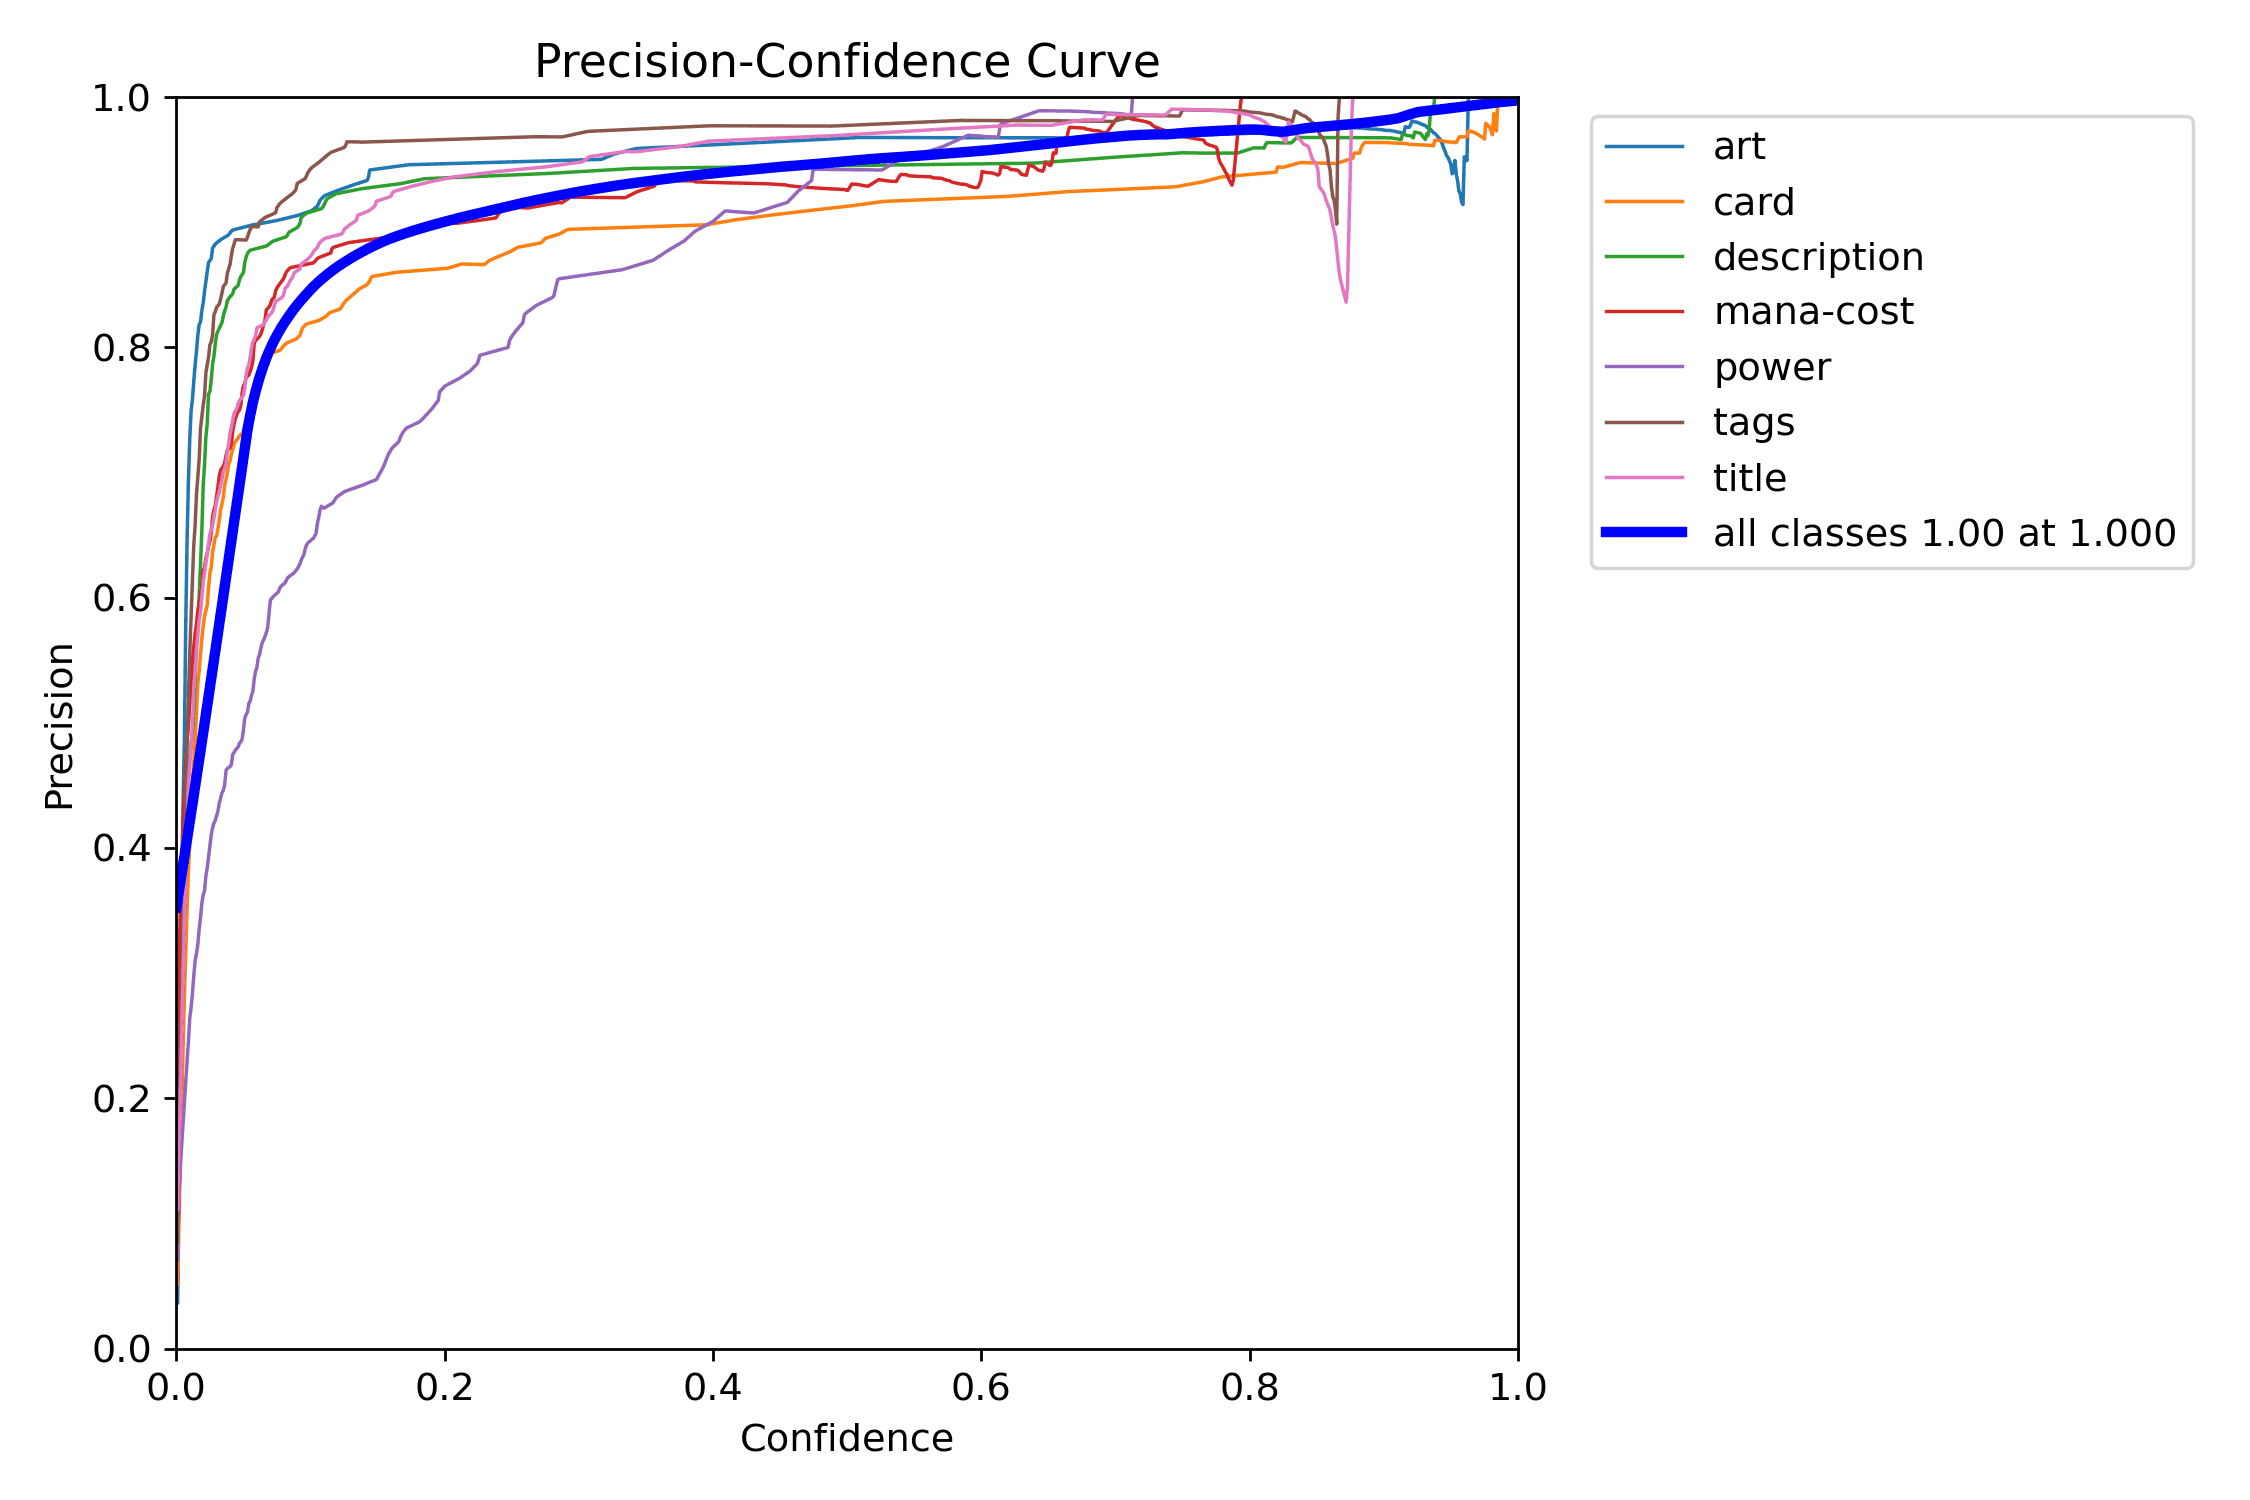
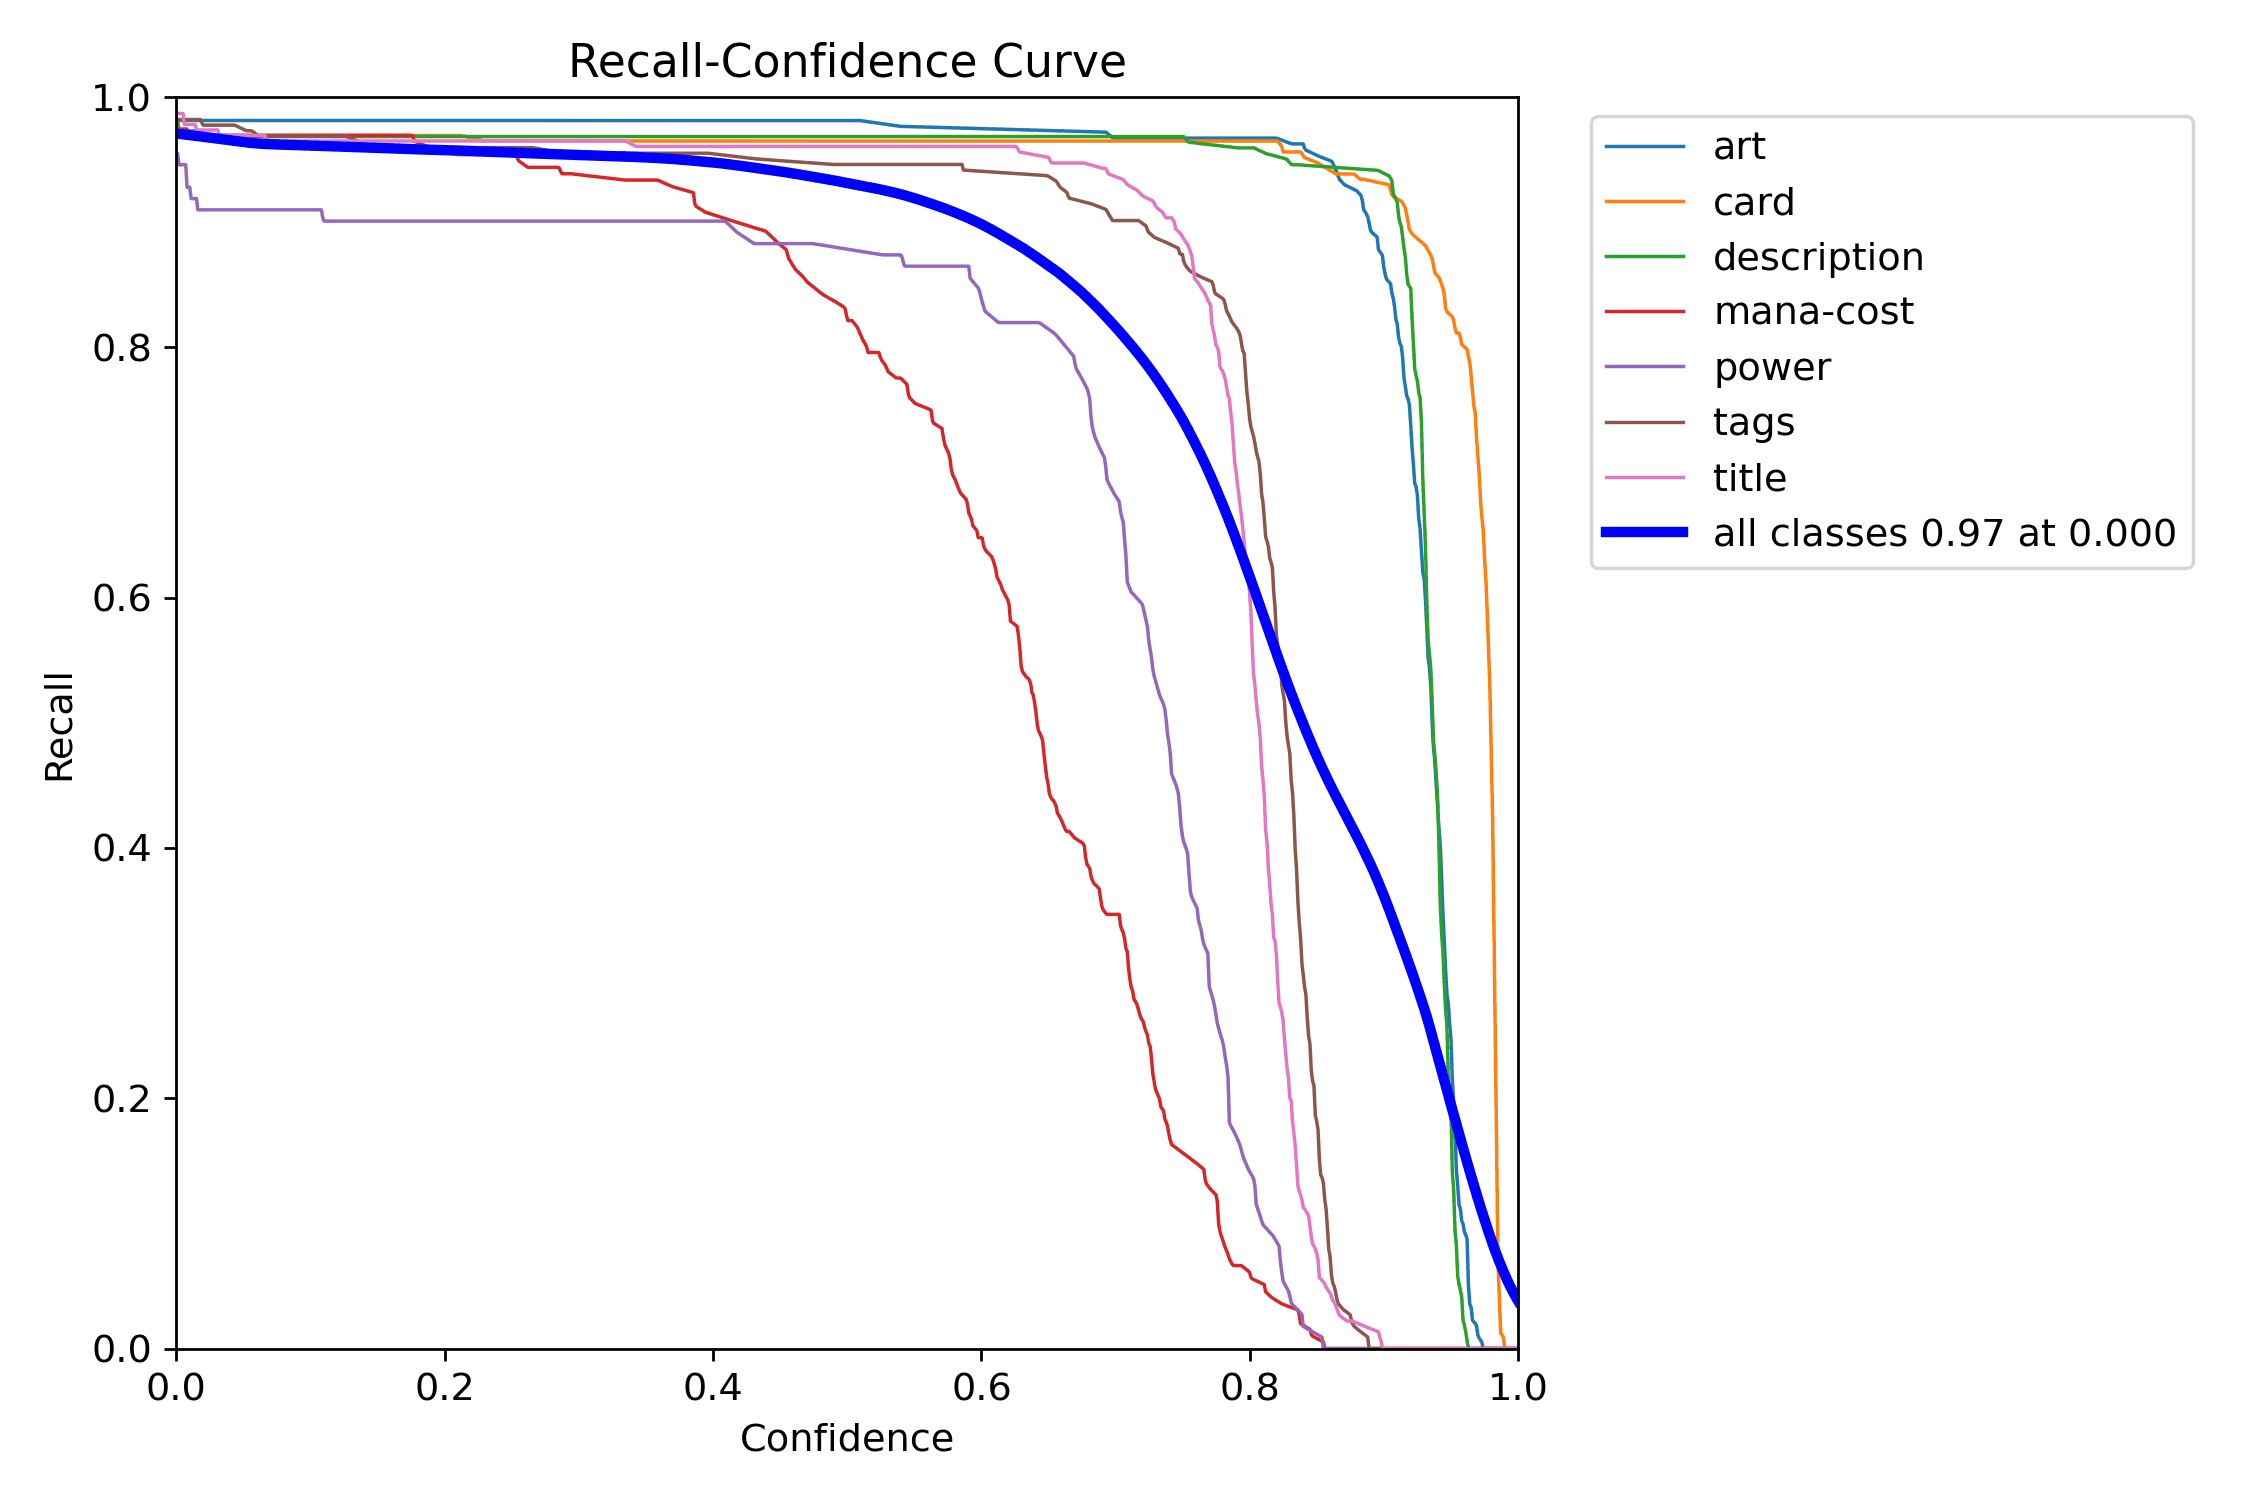
The precision and recall curves make the same threshold decision legible from opposite sides: one shows how aggressively false positives drop, the other shows what you pay in missed detections.
Conclusion
The detector's metrics are impressive, but the most valuable thing about them is not that they are high. It is that they are interpretable.
You can read the results and infer where the model is robust, where localization is brittle, and where the real ceiling is likely coming from. That makes the metrics useful for engineering, not just presentation.
Next, we follow the model output into the identification pipeline, where detection becomes OCR, lookup, and visual matching.
Further Reading
- Metrics guide:
docs/metrics-guide.md - Full solution document:
docs/solution.md - YOLO validation docs: https://docs.ultralytics.com/modes/val/
- Generalized IoU: https://arxiv.org/abs/1902.09630
- Distribution Focal Loss: https://arxiv.org/abs/2006.04388